Think This Is a Housing Crisis? Think Again.
With all of the unanswered questions caused by COVID-19 and the economic slowdown we’re experiencing across the country today, many are asking if the housing market is in trouble. For those who remember 2008, it’s logical to ask that question.
Many of us experienced financial hardships, lost homes, and were out of work during the Great Recession – the recession that started with a housing and mortgage crisis. Today, we face a very different challenge: an external health crisis that has caused a pause in much of the economy and a major shutdown of many parts of the country.
Let’s look at five things we know about today’s housing market that were different in 2008.
1. Appreciation
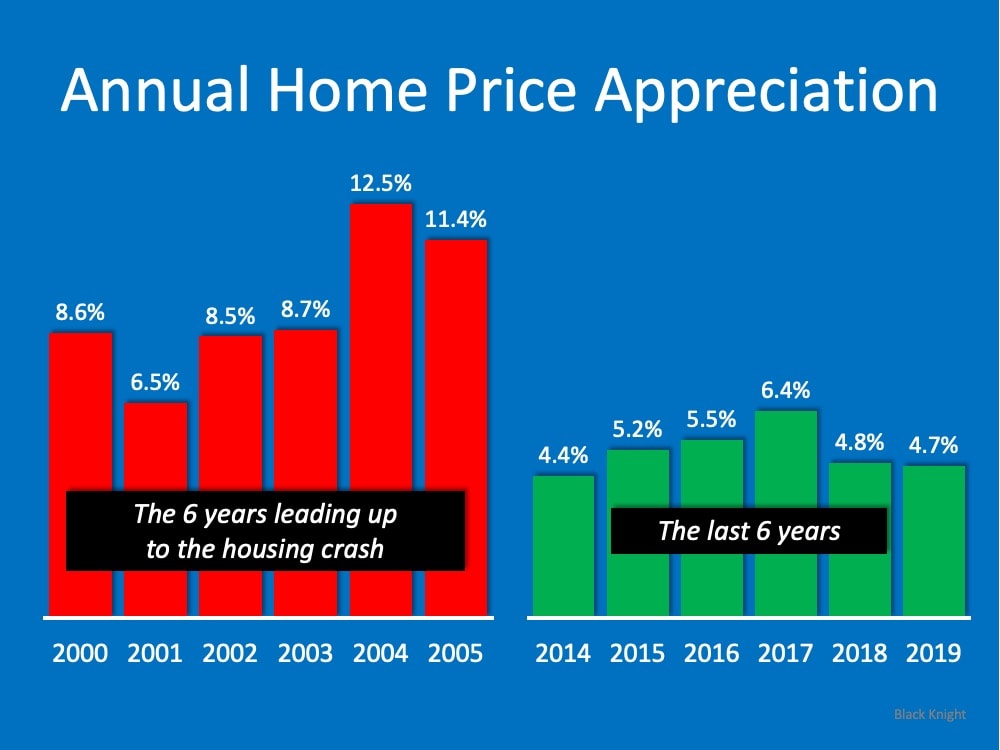
When we look at appreciation in the visual below, there’s a big difference between the 6 years prior to the housing crash and the most recent 6-year period of time. Leading up to the crash, we had much higher appreciation in this country than we see today. In fact, the highest level of appreciation most recently is below the lowest level we saw leading up to the crash. Prices have been rising lately, but not at the rate they were climbing back when we had runaway appreciation.
2. Mortgage Credit
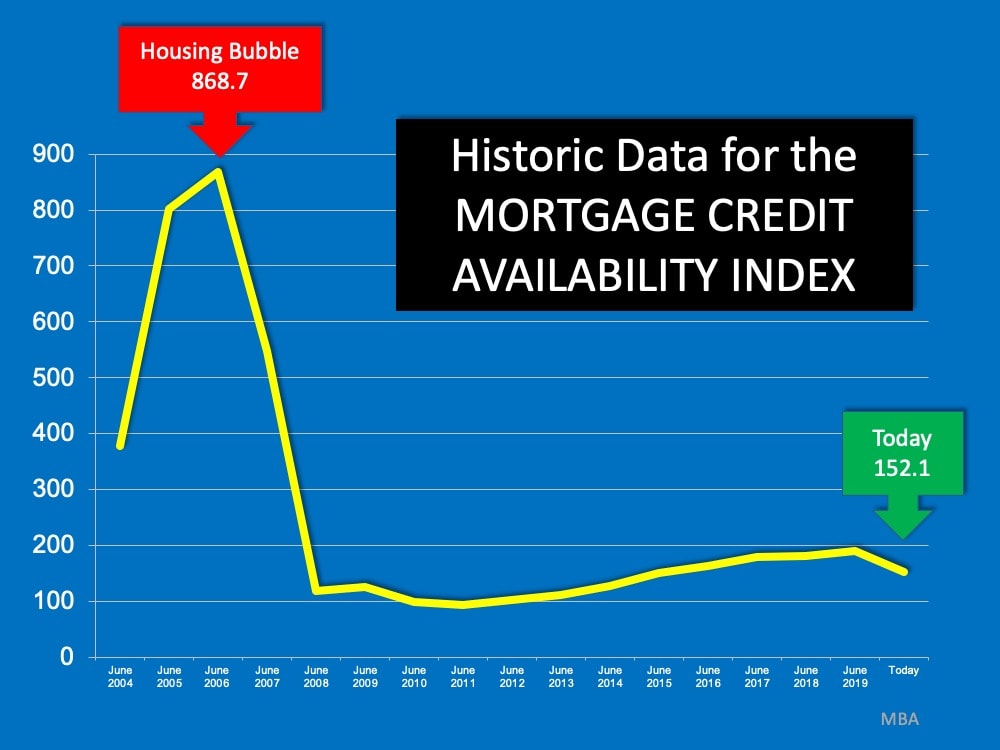
The Mortgage Credit Availability Index is a monthly measure by the Mortgage Bankers Association that gauges the level of difficulty to secure a loan. The higher the index, the easier it is to get a loan; the lower the index, the harder. Today we’re nowhere near the levels seen before the housing crash when it was very easy to get approved for a mortgage. After the crash, however, lending standards tightened and have remained that way leading up to today.
3. Number of Homes for Sale
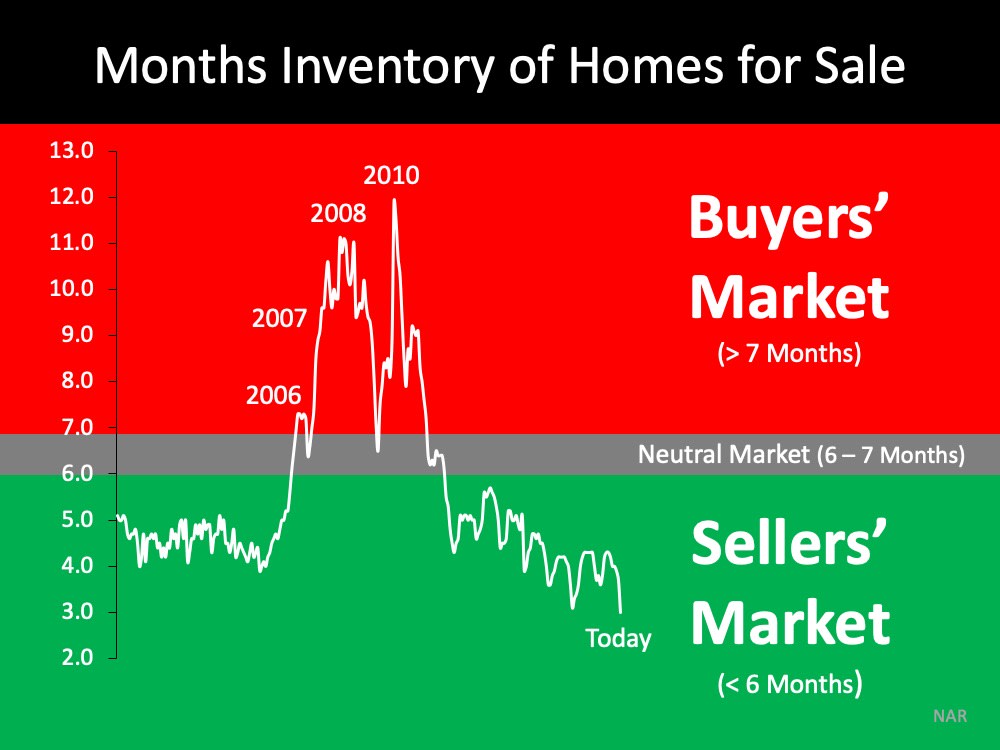
One of the causes of the housing crash in 2008 was an oversupply of homes for sale. Today, as shown in the next image, we see a much different picture. We don’t have enough homes on the market for the number of people who want to buy them. Across the country, we have less than 6 months of inventory, an undersupply of homes available for interested buyers.
4. Use of Home Equity
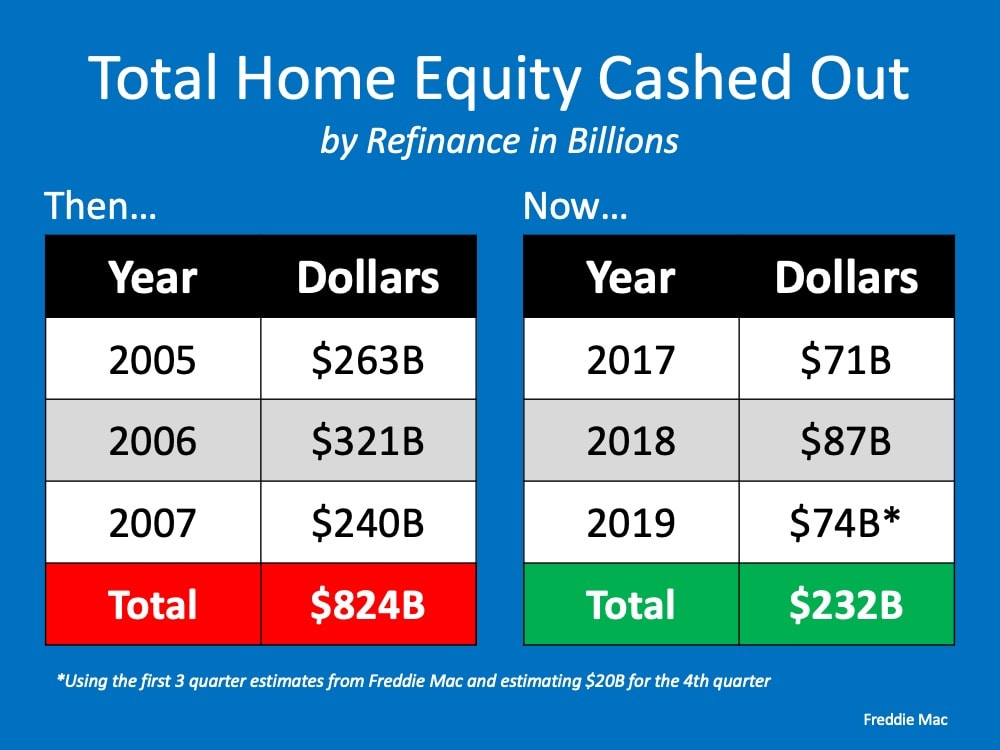
The chart below shows the difference in how people are accessing the equity in their homes today as compared to 2008. In 2008, consumers were harvesting equity from their homes (through cash-out refinances) and using it to finance their lifestyles. Today, consumers are treating the equity in their homes much more cautiously.
5. Home Equity Today
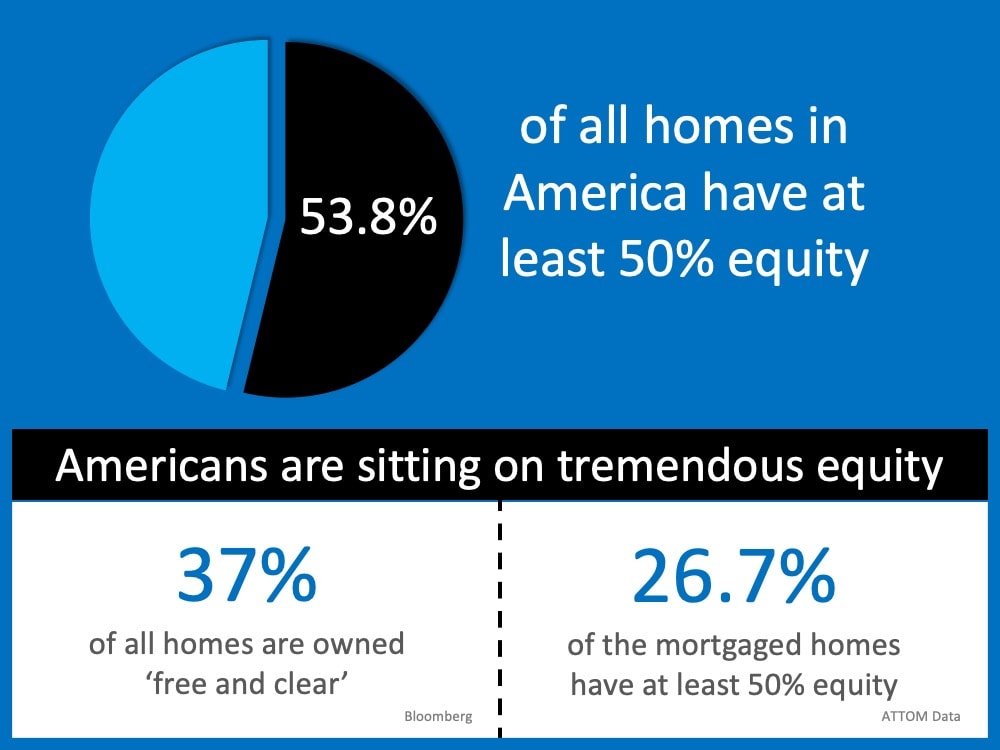
Today, 53.8% of homes across the country have at least 50% equity. In 2008, homeowners walked away when they owed more than what their homes were worth. With the equity homeowners have now, they’re much less likely to walk away from their homes.
Bottom Line
The COVID-19 crisis is causing different challenges across the country than the ones we faced in 2008. Back then, we had a housing crisis; today, we face a health crisis. What we know now is that housing is in a much stronger position today than it was in 2008. It is no longer the center of the economic slowdown. Rather, it could be just what helps pull us out of the downturn.